The EDI data provides an update on our progress with achieving the institutional EDI measures in Belonging at the University and is based on the latest data (2023/24).
Pillar 1: People Profile
In 2023/24, the ethnic diversity of our overall workforce (15% of colleagues from minoritised ethnic backgrounds) and the gender diversity in our management contract roles (53% female) have remained the same as 2022/23. However, the proportion of female professors have reduced to 41% in 2023/24 from 43% last year.
In 2024/25, we’ll be establishing a self-assessment team to renew our Athena Swan Bronze award in March 2026 and developing a gender equality action plan.
The proportion of colleagues completing the religion and belief diversity question has remained static for the last three years (89%) and there has been a slight decrease in the proportion of colleagues completing the sexual orientation diversity question (90% from 91% in 2022/23). These figures include colleagues who have responded with ‘prefer not to say’.
In 2024/25, we’ll be finalising guidance on religion and belief as well as continuing to communicate about why we collect diversity information and how it helps us create a more fair, diverse, and inclusive university.
The proportion of colleagues sharing that they have one or more disability has remained static for the fourth year in a row.
In 2023/24 we launched a workplace adjustments passport. In 2024/25 we’ll continue to work with our Staff Disability Network, Neurodivergent Group, and Business Disability Forum to create a more disability inclusive workplace and develop as a Disability Confident Scheme Employer.
| EDI metric | Target (%) | 2019-20 (%) | 2020-21 (%) | 2021-22 (%) | 2022-24 (%) | 2023-24 (%) | Direction |
|---|---|---|---|---|---|---|---|
| Minimum overall Black, Asian, and Minority Ethnic people profile | 20 | 13 | 14 | 14 | 15 | 15 | Same |
| Minimum of 7%, across all grades declaring a disability | 7 | 3 | 4 | 4 | 4 | 4 | Same |
| Achieve appropriate gender representation in management | 59 | 54 | 52 | 51 | 53 | 53 | Same |
| Minimum of 50% professors | 50 | 37 | 38 | 41 | 43 | 41 | Down |
| Improve people disclosure rates - sexual orientation | 95 | 88 | 88 | 89 | 89 | 89 | Down |
| Improve people disclosure rates - religion and belief | 95 | 88 | 88 | 89 | 89 | 89 | Same |
Pillar 2: Learner Outcomes
In 2023/24, our new Access and Participation Plan was developed for 2025-26 through to 2028-29. This sets out interventions to address gaps in learner outcomes. The latest data on graduate outcome gaps will be available in April/May 2025 and relate to the 2022/23 graduate cohort (based on a survey 15 months after graduation).
| EDI metric | Target (%) | 2019-20 (%) | 2020-21 (%) | 2021-22 (%) | 2022-23 (%) | 2023-24 (%) |
|---|---|---|---|---|---|---|
| Physics undergraduate female learner (UK Domicile) recruitment in all STEM areas to exceed the sector average | 26+ | 19 | 16 | 17 | 9 | Available spring 2025 |
| Chemistry undergraduate female learner (UK Domicile) recruitment in all STEM areas to exceed the sector average | 46+ | 37 | 36 | 36 | 40 | Available spring 2025 |
| Engineering undergraduate female learner (UK Domicile) recruitment in all STEM areas to exceed the sector average | 19+ | 10 | 9 | 11 | 12 | Available spring 2025 |
| Computing undergraduate female learner (UK Domicile) recruitment in all STEM areas to exceed the sector average | 20+ | 10 | 10 | 12 | 14 | Available spring 2025 |
| Recruitment to PGR programmes to have exceeded the sector average in relation to students of Black, Asian, and Minority Ethnic heritage (UK Domicile) | 18+ | 14 | 15 | 14 | 15 | Available spring 2025 |
| Recruitment to PGT programmes to have exceeded the sector average in relation to students of Black, Asian, and Minority Ethnic heritage (UK Domicile) | 23+ | 19 | 19 | 20 | 23 | Available spring 2025 |
| To eliminate the award gap for undergraduate learners in relation to learners from a Black, Asian, or Minority Ethnic heritage (UK Domicile) | 0 | 10 | 12 | 11 | 13 | Available spring 2025 |
| To eliminate the award gap in relation to disabled learners (UK Domicile) – gap in favour of disabled students | 0 | 1 | 1 | 1 | -4 | Available spring 2025 |
| To eliminate the award gap in relation to part-time disabled learners (UK Domicile) - gap in favour of part-time non-disabled learners | 0 | 11 | 12 | 11 | 18 | Available spring 2025 |
| To eliminate graduate outcome gaps in relation to Black, Asian, and Minority Ethnic heritage graduates | 0 | 8 | 2 | 7 | 5 | Available spring 2025 |
| To eliminate graduate outcome gaps in relation to disabled graduates | 0 | 13 | 7 | 3 | 9 | Available spring 2025 |
| To eliminate graduate outcome gaps in relation to male graduates | 0 | 5 | 5 | 3 | 5 | Available spring 2025 |
Graduate outcome data relate to the graduate cohort for the previous year, as it’s based on a survey 15 months after graduation. For example, data on graduate outcomes reported in column 2021-22 relate to our 2020/21 graduate cohort, as this information was available in spring 2022.
Diversity of our students (2021/22-2023/24)
The following data on student demographics is based on data from Banner, gathered internally at student enrolment. These include all levels of study and learners from Preston, Burnley, and Westlakes campuses for UK domicile students only (students who are residents of UK), as not all diversity information is currently collected for non-UK Students.
Profile of students by age
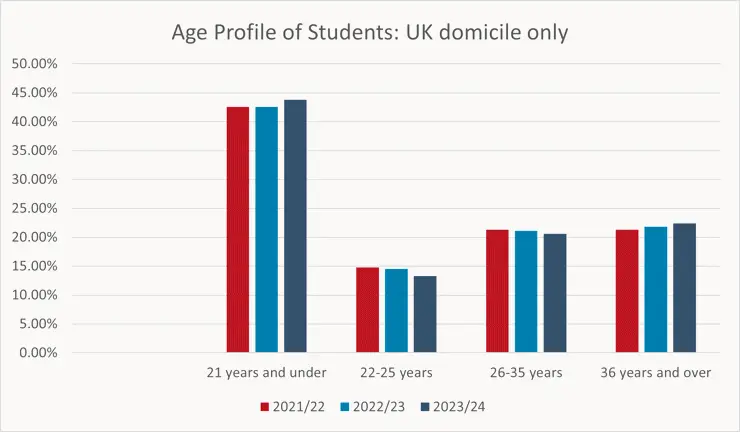
The following table provides the age profile of UK domicile students. Most of our UK domicile students are 21 years and under (43.8% in 2023/24). There was a slight increase in the proportion of UK domicile students in the 21 years and under and in the 36 years age categories with corresponding reductions in the 22-25 years and 26-35 years age categories.
| Age on entry | 2021/22 (%) | 2022/23 (%) | 2023/24 (%) |
|---|---|---|---|
| 21 years and under | 42.6 | 42.6 | 43.8 |
| 22-25 years | 14.8 | 14.5 | 13.3 |
| 26-35 years | 21.3 | 21.1 | 20.6 |
| 36 years and over | 21.3 | 21.8 | 22.4 |
Profile of students by disability
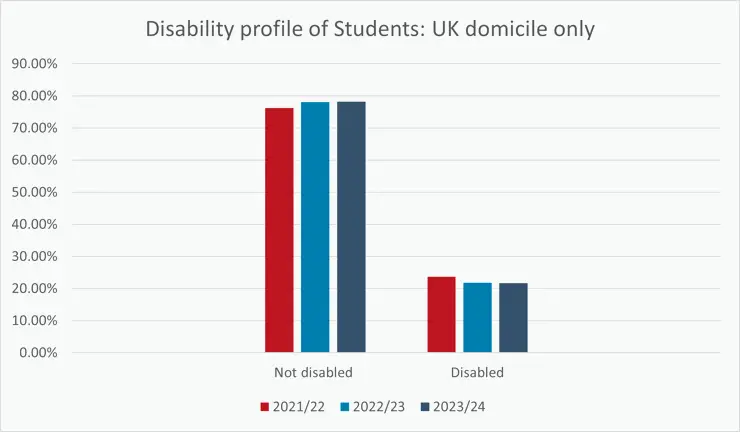
The following table provides the disability profile of UK domicile students. The proportion of UK domicile students sharing that they have a disability has reduced over the last three years (from 23.7% in 2021/22 to 21.7% in 2023/24).
| Disability | 2021/22 (%) | 2022/23 (%) | 2023/24 (%) |
|---|---|---|---|
| Disabled | 23.7 | 21.9 | 27.7 |
| Not disabled | 76.3 | 78.1 | 78.3 |
Disability profile of students by type of disability
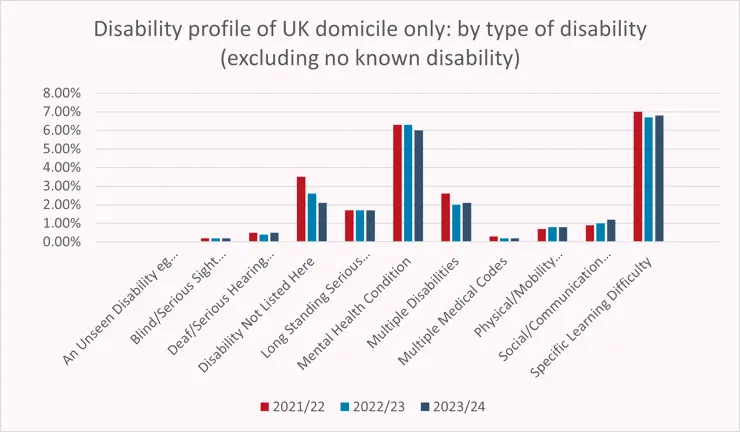
Learning and mental health related disabilities continue to be the main disabilities shared by UK domicile students (6.8% for specific learning disability and 6.0% for mental health conditions). The proportion of students sharing a social or communication related disability has increased slightly over the last three years (0.9% in 2021/22 to 1.2% in 2023/24).
The following table provides detailed information about the types of disabilities our UK domicile students have shared.
| Type of Disability | 2020/22 (%) | 2022/23 (%) | 2023/24 (%) |
|---|---|---|---|
| An Unseen Disability, e.g. Asthma | 0.00 | ||
| Blind/Serious Sight Impairment | 0.2 | 0.2 | 0.2 |
| Deaf/Serious Hearing Disorder | 0.5 | 0.4 | 0.5 |
| Disability Not Listed Here | 3.5 | 2.6 | 2.1 |
| Long Standing Serious Illness | 1.7 | 1.7 | 1.7 |
| Mental Health Condition | 6.3 | 6.3 | 6.0 |
| Multiple Disabilities | 2.6 | 2.0 | 2.1 |
| Multiple Medical Codes | 0.3 | 0.2 | 0.2 |
| Physical/Mobility Impairment | 0.7 | 0.8 | 0.8 |
| Social/Communication Disorder | 0.9 | 1.0 | 1.2 |
| Specific Learning Difficulty | 7.0 | 6.7 | 6.8 |
| No known disability | 76.3 | 78.1 | 78.3 |
Profile of students by sex
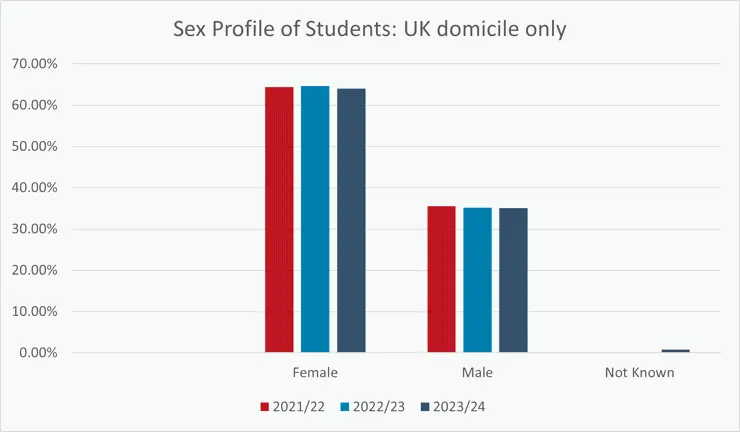
Female students continue to make up almost two-thirds of UK domicile students, with the male/female split remaining relatively consistent over the last three years.
The following table provides the sex profile of UK domicile students.
| Sex | 2021/22 (%) | 2022/23 (%) | 2023/24 (%) |
|---|---|---|---|
| Female | 64.4 | 64.7 | 64.0 |
| Male | 35.5 | 35.2 | 35.1 |
| Not known | 0.2 | 0.2 | 0.8 |
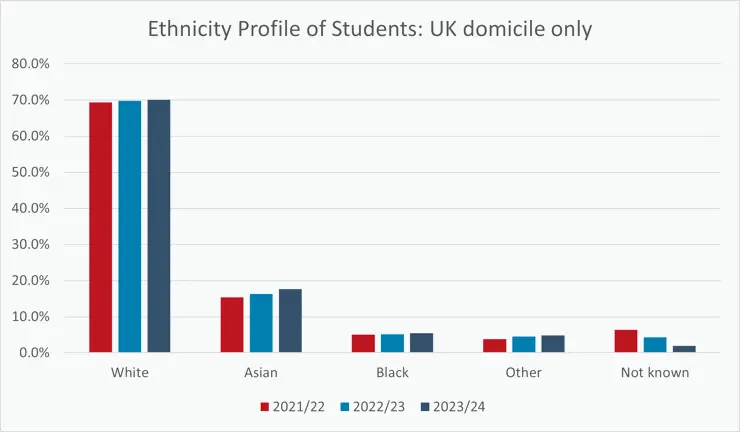
Profile of students by ethnicity
There has been an increase in the proportion of minoritised ethnic UK domicile students across all ethnicity groups, particularly the proportion of Asian UK domicile students (17.7% in 2023/24 from 15.4% in 2021/22). The proportion of UK domicile students not sharing their ethnicity has also reduced from 6.4% in 2021/22 to 1.9% in 2023/24.
The following table provides the ethnicity profile of UK domicile students.
| Ethnicity | 2021/22 (%) | 2022/23 (%) | 2023/24 (%) |
|---|---|---|---|
| White | 69.3 | 69.8 | 70.1 |
| Asian | 15.4 | 16.3 | 17.7 |
| Black | 5.0 | 5.1 | 5.5 |
| Other | 3.8 | 4.5 | 4.8 |
| Not known | 6.4 | 4.3 | 1.9 |
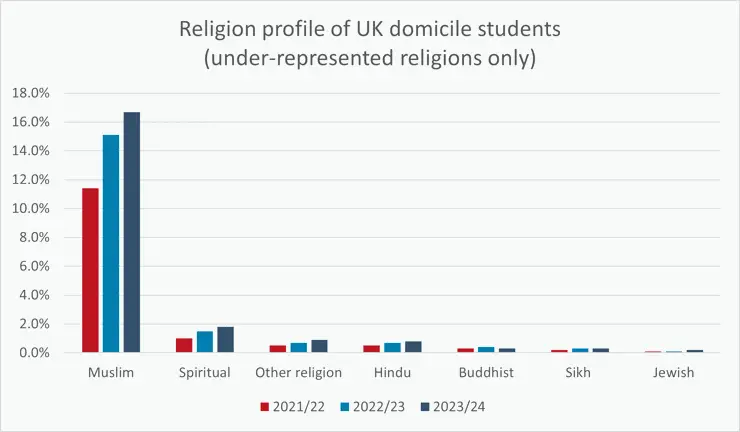
Profile of students by religion
There has been a substantial increase in the proportion of UK domicile students providing their religion information, with the proportion of not knowns or information refused reducing from 33.4% in 2021/22 to 4.3% in 2023/24.
During this time there has been an increase in the proportion of Muslim students (from 11.4% in 2021/22 to 16.7% in 2023/24). There have also been slight increases in the proportion of UK domicile students who are spiritual, Hindu, Jewish and from an ‘other religion’ over the three-year period.
The following chart and table provide the religion profile of UK domicile students.
| Religion | 2021/22 (%) | 2022/23 (%) | 2023/24 (%) |
|---|---|---|---|
| No Religion | 30.7 | 40.8 | 42.8 |
| Christian (CoE, Catholic etc.) | 21.8 | 30.0 | 31.9 |
| Muslim | 11.4 | 15.1 | 16.7 |
| Spiritual | 1.0 | 1.5 | 1.8 |
| Other religion | 0.5 | 0.7 | 0.9 |
| Hindu | 0.5 | 0.7 | 0.8 |
| Buddhist | 0.3 | 0.4 | 0.3 |
| Sikh | 0.2 | 0.3 | 0.3 |
| Jewish | 0.1 | 0.1 | 0.2 |
| Not known/information refused | 33.4 | 10.4 | 4.3 |
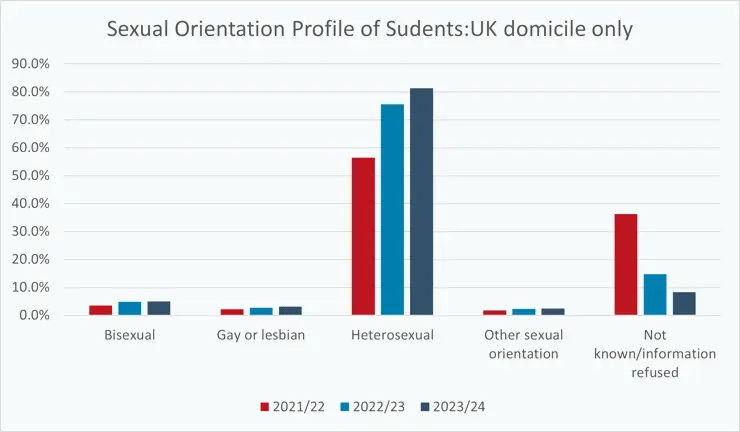
Profile of students by sexual orientation
There has been a substantial increase in the proportion of UK domicile students providing their sexual orientation information, with the proportion of 'not known' or information refused reducing from 36.3% in 2021/22 to 8.3% in 2023/24.
During this time there have been increases in the proportion of UK domicile students across all sexual orientation categories, with the largest increase for heterosexual students (from 56.4% in 2021/22 to 81.3% in 2023/24).
The following table provides the profile of UK domicile students by sexual orientation.
| Sexual orientation | 2021/22 (%) | 2022/23 (%) | 2023/24 (%) |
|---|---|---|---|
| Bisexual | 3.5 | 4.8 | 5.0 |
| Gay or lesbian | 2.1 | 2.7 | 3.1 |
| Heterosexual | 56.4 | 75.5 | 81.3 |
| Other sexual orientation | 1.7 | 2.3 | 2.4 |
| Not known/information refused | 36.3 | 14.7 | 8.3 |
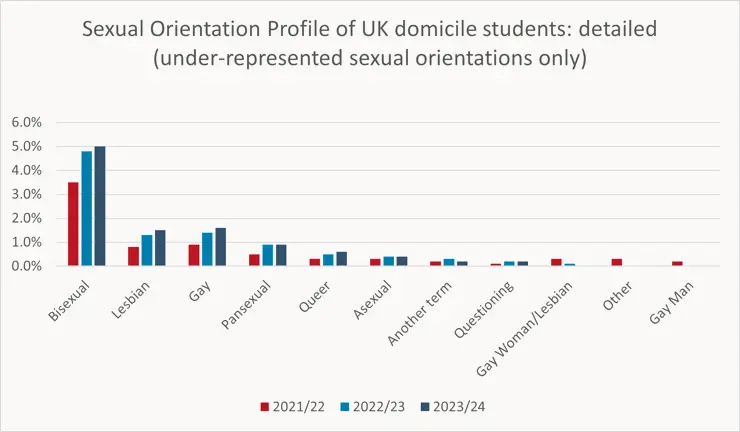
Profile of students by sexual orientation (detailed)
There has been a substantial increase in the proportion of bisexual UK domicile students in the last three years (from 3.5% in 2021/22 to 5.0% in 2023/24) and increases in more under-represented sexual orientation groups, including pansexual and asexual.
There have been increases in the proportion of UK domicile students selecting lesbian and gay, and corresponding reductions in the proportion of UK domicile students selecting gay woman/lesbian and gay man categories.
The following table provides more detailed information about the profile of UK domicile students by sexual orientation.
| Sexual Orientation | 2021/22 (%) | 2022/23 (%) | 2023/24 (%) |
|---|---|---|---|
| Heterosexual | 56.4 | 75.5 | 81.3 |
| Bisexual | 3.5 | 4.8 | 5.0 |
| Lesbian | 0.8 | 1.3 | 1.5 |
| Gay | 0.9 | 1.4 | 1.6 |
| Pansexual | 0.5 | 0.9 | 0.9 |
| Queer | 0.3 | 0.5 | 0.6 |
| Asexual | 0.3 | 0.4 | 0.4 |
| Another term | 0.2 | 0.3 | 0.2 |
| Questioning | 0.1 | 0.2 | 0.2 |
| Gay woman/lesbian | 0.3 | 0.1 | 0.0 |
| Other | 0.3 | 0.0 | 0.0 |
| Gay man | 0.2 | 0.0 | 0.0 |
| Not known/information refused | 36.3 | 14.7 | 8.3 |
Diversity of our students: Summary
We’ve continued to improve the quality of the diversity information we hold about UK domicile students, with an increase in the proportion of students sharing their ethnicity information from last year and a substantial increase in the proportion of UK domicile students sharing their religion information and their sexual orientation information. Increasing the proportion of students sharing diversity information helps us to understand the experience of our diverse students and to identify potential barriers to representation, progression, and success so that we can take action to address these.
The proportion of UK domicile students sharing that they have a disability has reduced over the last three years. Disabilities relating to learning and to mental health continue to be the main disabilities shared by UK domicile students. In 2023/24, we’ve been developing a whole institutional approach to mental health and working towards a future submission for the University Mental Health Charter in 2024/25. Our Inclusive Support for disabled students has also been further strengthened through taking part in the Disabled Student Commitment.
The ethnic diversity, religious diversity, and diversity of sexual orientations of UK domicile students has also increased over the last three years, with increases across all ethnicity groups, most religious groups and all sexual orientation categories.
Diversity of our colleagues (2021/22-2023/24)
The following data on colleague demographics is based on the staff return for the Higher Education Statistics Agency (HESA). This includes all colleagues across Preston, Burnley, and Westlakes campuses.
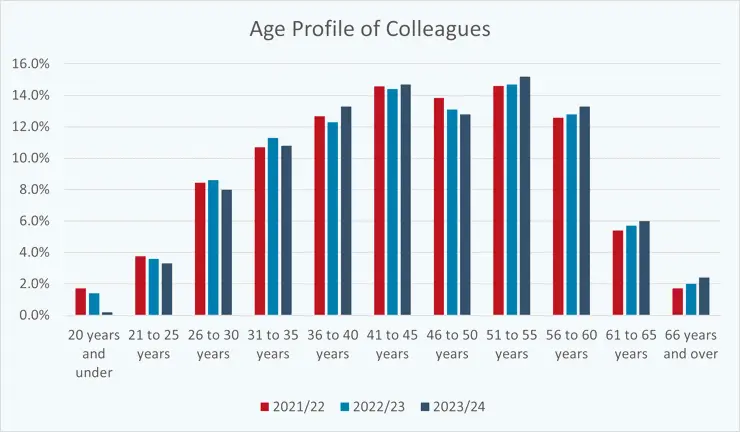
Profile of colleagues by age
There has been a significant decrease in the proportion of colleagues in the 20 years and under age group (from 1.7% in 2021/22 to 0.2% in 2023/24) and a continuing decrease in the 21-25 years age group (from 3.8% in 2021/22 to 3.3% in 2023/24).
The proportion of colleagues in the older age categories (56 years and older) has continued to increase over the last three years. There has been a decrease in the proportion of colleagues in the 46 to 50 years age category (from 13.8% in 2021/22 to 12.8% in 2023/24).
The following table provides the age profile of colleagues.
| Age | 2021/22 | 2022/23 | 2023/24 |
|---|---|---|---|
| 20 years and under | 1.7 | 1.4 | 0.2 |
| 21 to 25 years | 3.8 | 3.6 | 3.3 |
| 26 to 30 years | 8.4 | 8.6 | 8.0 |
| 31 to 35 years | 10.7 | 11.3 | 10.8 |
| 36 to 40 years | 12.7 | 12.3 | 13.3 |
| 41 to 45 years | 14.6 | 14.4 | 14.7 |
| 46 to 50 years | 13.8 | 13.1 | 12.8 |
| 51 to 55 years | 14.6 | 14.7 | 15.2 |
| 56 to 60 years | 12.6 | 12.8 | 13.3 |
| 61 to 65 years | 5.4 | 5.7 | 6.0 |
| 66 years and over | 1.7 | 2.0 | 2.4 |
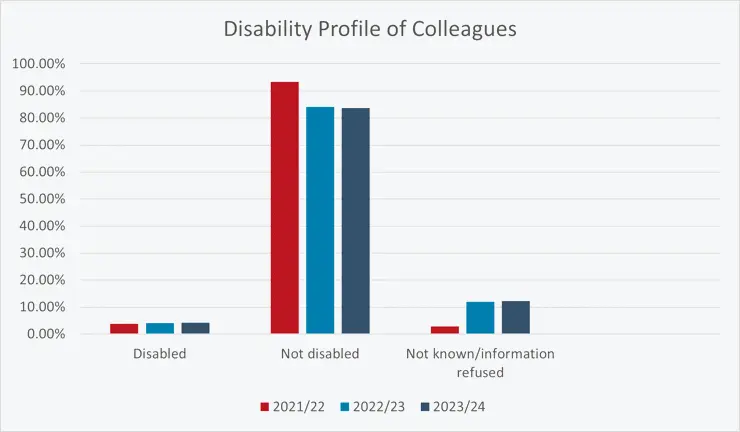
Profile of colleagues by disability
The proportion of colleagues sharing that they have a disability has remained constant over the last three years (4%). In 2022/23, there was an increase in the proportion of colleagues who have not completed the disability question in our People system or who have responded with ‘prefer not to say’ and this has remained the same at 12% in 2023/24.
The following table provides the disability profile of colleagues.
| Disability | 2021/22 (%) | 2022/23 (%) | 2023/24 (%) |
|---|---|---|---|
| Disabled | 3.8 | 4.1 | 4.2 |
| Not disabled | 93.4 | 84.1 | 83.7 |
| Not known/information refused | 2.8 | 11.9 | 12.2 |
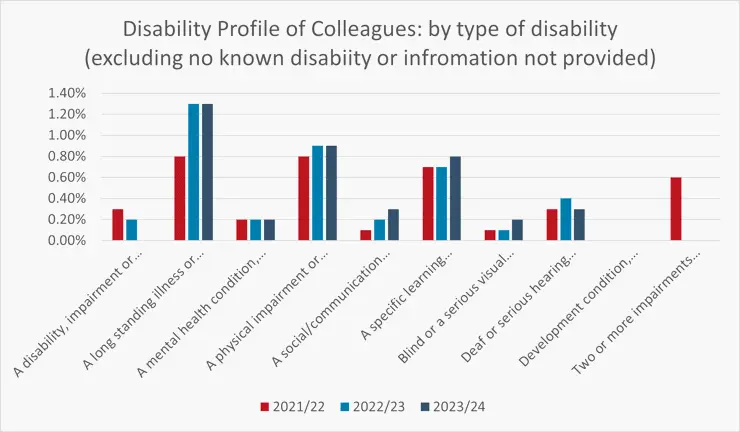
Disability profile of colleagues by type of disability
The main type of disability our colleagues have shared is a long-standing illness or health condition, such as cancer, HIV, diabetes, chronic heart disease, or epilepsy (1.3% in 2023/24).
There have been increases in the proportion of colleagues sharing that they are neurodivergent, including social or communication (from 0.1% in 2021/22 to 0.3% in 2023/24) and learning or cognitive (from 0.7% in 2021/22 to 0.8% in 2023/24).
The following chart and table provide detailed information about the types of disabilities our colleagues have, where this information is provided.
| Disability type | 2021/22 (%) | 2022/23 (%) | 2023/24 (%) |
|---|---|---|---|
| Not known/information refused | 6.2 | 11.9 | 12.2 |
| No known disability | 90.0 | 84.1 | 83.7 |
| A disability, impairment, or medical condition that is not listed above | 0.3 | 0.2 | 0.2 |
| A long-standing illness or health condition such as cancer, HIV, diabetes, chronic heart disease, or epilepsy | 0.8 | 1.3 | 1.3 |
| A mental health condition, such as depression, schizophrenia, or anxiety disorder | 0.2 | 0.2 | 0.2 |
| A physical impairment or mobility issues, such as difficulty using arms or using a wheelchair or crutches | 0.8 | 0.9 | 0.9 |
| A social/communication impairment such as Asperger's syndrome/other autistic spectrum disorder | 0.1 | 0.2 | 0.3 |
| A specific learning difficulty such as dyslexia, dyspraxia, or AD(H)D | 0.7 | 0.7 | 0.8 |
| Blind or a serious visual impairment uncorrected by glasses | 0.1 | 0.1 | 0.2 |
| Deaf or serious hearing impairment | 0.3 | 0.4 | 0.3 |
| Development condition since childhood affecting motor, cognitive, social, emotive skills, speech, and language | 0 | 0 | |
| Two or more impairments and/or disabling medical conditions | 0.6 |
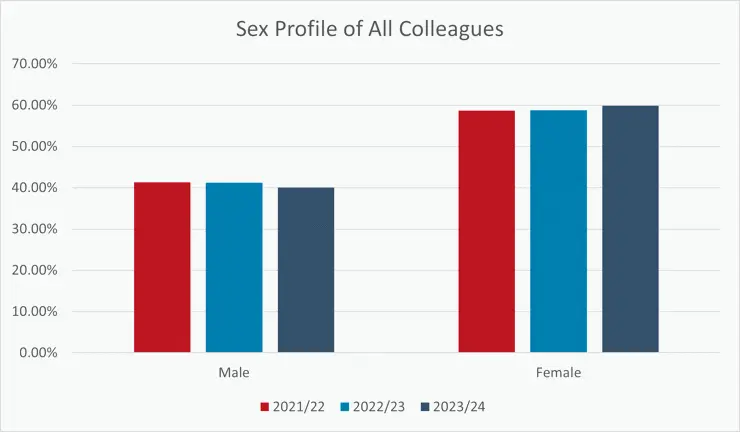
Profile of colleagues by sex
The profile of colleagues by sex has remained relatively static over the last three years, with female colleagues making up the majority of our workforce.
There has been a slight increase in the proportion of female colleagues from 58.7% in 2021/22 to 59.9% in 2023/24.
The following table provides the sex profile of colleagues.
| Sex | 2021/22 (%) | 2022/23 (%) | 2023/24 (%) |
|---|---|---|---|
| Male | 41.3 | 41.2 | 40.1 |
| Female | 58.7 | 58.8 | 59.9 |
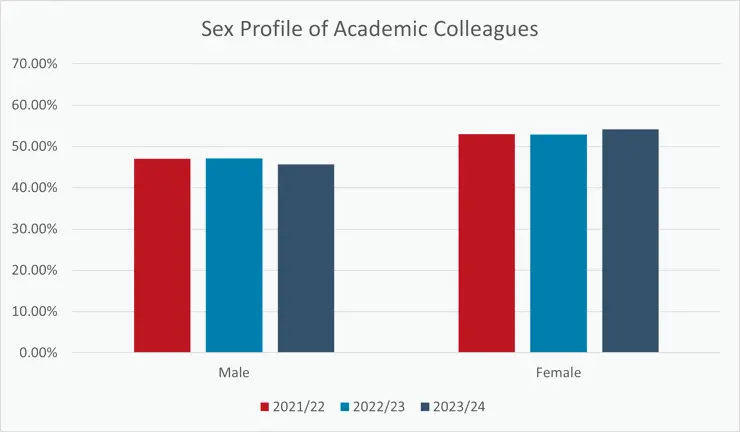
Profile of academic colleagues by sex
Female academic colleagues continue to make up the majority of our academic workforce, increasing from 53.0% in 2021/22 to 54.2% in 2023/24.
The following chart and table provide the sex profile of academic colleagues.
| Sex | 2021/22 (%) | 2022/23 (%) | 2023/24 (%) |
|---|---|---|---|
| Male | 47.0 | 47.1 | 45.7 |
| Female | 53.0 | 52.9 | 54.2 |
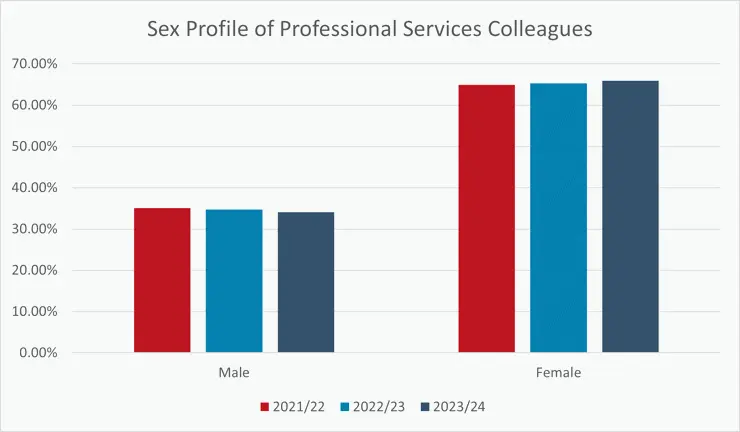
Profile of Professional Services colleagues by sex
The profile of professional services colleagues by sex has remained relatively static over the last three years, with female professional services colleagues making up almost two-thirds of our professional services workforce (65.9% in 2023/24).
The following chart and table provide the sex profile of professional services colleagues.
| Sex | 2021/22 (%) | 2022/23 (%) | 2023/24 (%) |
|---|---|---|---|
| Male | 35.1 | 34.7 | 34.1 |
| Female | 64.9 | 65.3 | 65.9 |
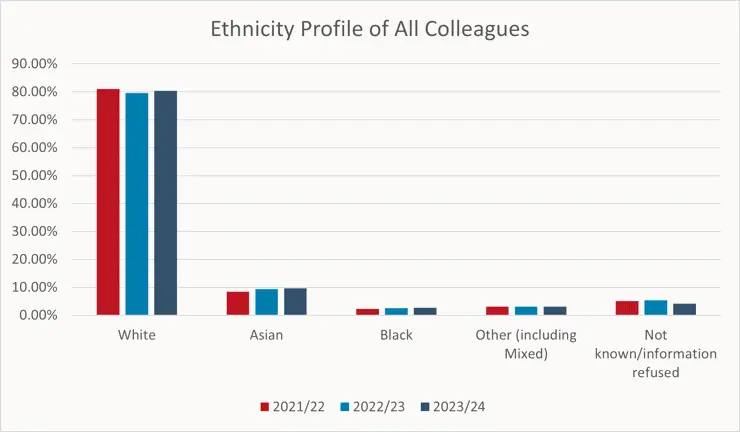
Profile of colleagues by ethnicity
There continues to be an increase in the proportion of Asian colleagues (from 8.5% in 2021/22 to 9.6% in 2023/24) and in the proportion of Black colleagues (from 2.3% in 2021/22 to 2.7% in 2023/24).
The proportion of colleagues who have not completed the ethnicity question in our People system or who have responded with ‘prefer not to say’ has reduced over the last three years from 5.1% in 2021/22 to 4.2% in 2023/24.
The following table provides the ethnicity profile of colleagues.
| Ethnicity | 2021/22 | 2022/23 | 2023/24 |
|---|---|---|---|
| White | 81.0 | 79.6 | 80.4 |
| Asian | 8.5 | 9.4 | 9.6 |
| Black | 2.3 | 2.6 | 2.7 |
| Other (including mixed) | 3.1 | 3.1 | 3.1 |
| Not known/information refused | 5.1 | 5.4 | 4.2 |
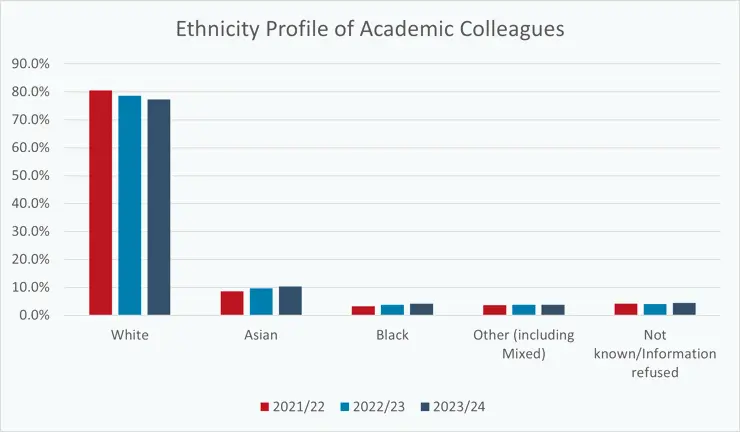
Profile of academic colleagues by ethnicity
There have been increases in the proportion of minoritised ethnic academic colleagues, most notably Black academic colleagues (from 3.2% in 2021/22 to 4.1% in 2023/24) and Asian academic colleagues (from 8.6% in 2021/22 to 10.3% in 2023/24).
The following table provides the ethnicity profile of academic colleagues.
| Ethnicity | 2021/22 (%) | 2022/23 (%) | 2023/24 (%) |
|---|---|---|---|
| White | 80.5 | 78.7 | 77.3 |
| Asian | 8.6 | 9.6 | 10.3 |
| Black | 3.2 | 3.8 | 4.1 |
| Other (including mixed) | 3.6 | 3.8 | 3.8 |
| Not known/information refused | 4.2 | 4.0 | 4.4 |
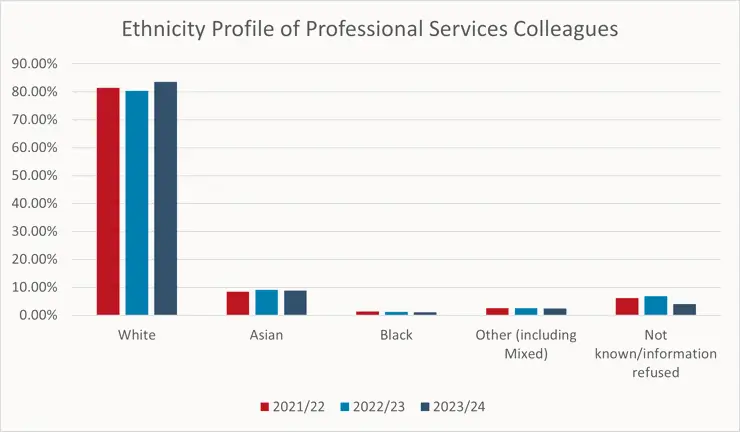
Profile of Professional Services colleagues by ethnicity
There has been a slight increase in the proportion of Asian colleagues in professional services over the last three years (from 8.4% in 2021/22 to 8.9% in 2023/24). However, the overall ethnic diversity of professional services colleagues has reduced with decreases in the proportion of professional colleagues selecting ‘Black’ and ‘Other (including Mixed)’ during this same period. The proportion of professional services colleagues who have not completed their ethnicity information or have responded with ‘prefer not to say’ than for all colleagues has reduced (from 6.2% in 2021/22 to 4.0% in 2023/24).
The following chart and table provide the ethnicity profile of professional services colleagues.
| Ethnicity | 2021/22 (%) | 2022/23 (%) | 2023/24 (%) |
|---|---|---|---|
| White | 81.5 | 80.4 | 83.6 |
| Asian | 8.4 | 9.1 | 8.9 |
| Black | 1.3 | 1.2 | 1.1 |
| Other (including mixed) | 2.6 | 2.5 | 2.4 |
| Not known/information refused | 6.2 | 6.8 | 4.0 |
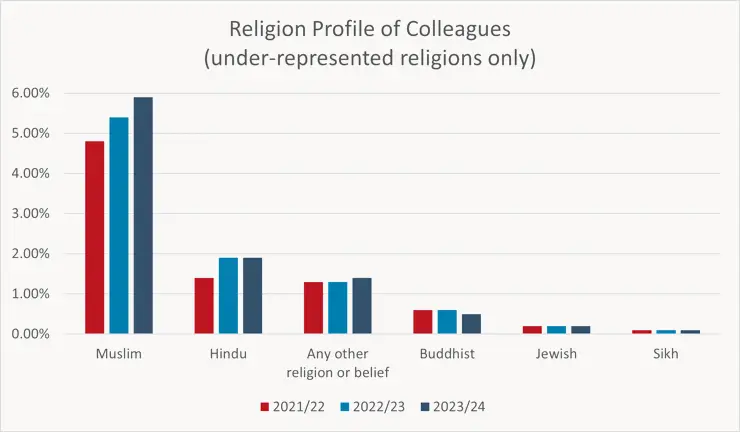
Profile of colleagues by religion
There has been a substantial increase in the proportion of colleagues providing their religion information, with those not completing the religion question or preferring not to say reducing from 26.1% in 2021/22 to 22.9% in 2023/24.
There have been increases in the proportion of Muslim colleagues (from 4.8% in 2021/22 to 5.9% in 2023/24) and Hindu colleagues (from 1.4% in 2021/22 to 1.9% in 2023/24).
The following chart and table provide the religion profile of colleagues.
| Religion | 2021/22 | 2022/23 | 2023/24 |
|---|---|---|---|
| Christian | 37.9 | 38.0 | 37.8 |
| Muslim | 4.8 | 5.4 | 5.9 |
| Hindu | 1.4 | 1.9 | 1.9 |
| Any other religion or belief | 1.3 | 1.3 | 1.4 |
| Buddhist | 0.6 | 0.6 | 0.5 |
| Jewish | 0.2 | 0.2 | 0.2 |
| Sikh | 0.1 | 0.1 | 0.1 |
| No religion | 27.6 | 29.1 | 29.3 |
| Not known/information refused | 26.1 | 23.3 | 22.9 |
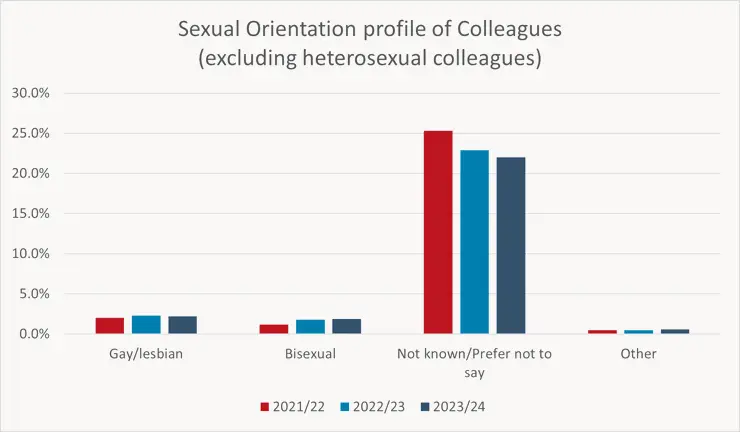
Profile of colleagues by sexual orientation
There has been a substantial increase in the proportion of colleagues providing their sexual orientation information, with those not completing the sexual orientation question or preferring not to say reducing from 25.3% in 2021/22 to 22.0% in 2023/24.
There has been an increase in the proportion of colleagues sharing that they are bisexual (from 1.2% in 2021/22 to 1.9% in 2023/24) and slight increases in the proportion of colleagues sharing that they are gay, lesbian, or a different sexual orientation.
The following table provides the profile of colleagues by sexual orientation.
| Sexual orientation | 2021/22 | 2022/23 | 2023/24 |
|---|---|---|---|
| Heterosexual | 71.0 | 72.5 | 73.4 |
| Gay/lesbian | 2.0 | 2.3 | 2.2 |
| Bisexual | 1.2 | 1.8 | 1.9 |
| Not known/information refused | 25.3 | 22.9 | 22.0 |
| Other | 0.5 | 0.5 | 0.6 |
Diversity of our colleagues: Summary
There have been improvements to the quality of the diversity information we hold about colleagues, with more colleagues providing this information in our People system. This helps us to understand the experience of our diverse colleagues and to identify potential barriers to representation and progression so that we can take action to address these. There is still a high proportion of colleagues not providing their sexual orientation or their religion. However, this has improved over the last three years. As Stonewall Diversity Champions we’ll continue to work with our LGBT+ Staff Network to develop an LGBT+ inclusive approach. In relation to religion, we’ll be finalising guidance on religion and belief in 2023/24.
A key area of concern continues to be the high proportion of colleagues not responding to the disability question or preferring not to share this information. We’ll continue to work with our Staff Disability Network and Neurodivergent Staff Group to understand the reasons for this and identify actions we can take to improve this. The recent launch of our workplace adjustments passport and new membership of Business Disability Forum will help us to support our disabled colleagues and work towards us being recognised as a Disability Confident Scheme Leader.
The proportion of minoritised ethnic colleagues has continued to increase over the last three years. However, there’s more for us to do, particularly to increase the ethnic diversity of our leadership. The development of our new five-year Race Equality Charter action plan will support this.
Female colleagues continue to make up the majority in both our academic and professional services, with a slight increase in the proportion of female academic colleagues this year.
Our workforce continues to be ageing, with a reduction in the proportion of younger colleagues and an increase in the proportion of older colleagues, which we’ll need to consider as part of our People Value Proposition work, along with wider EDI considerations.
As we develop our approach on EDI, we’ll look at developing a better understanding of intersectionality and the different experiences of colleagues with more than one diversity characteristic, e.g. Black female colleagues.
Pay gap reports
This section provides information about our gender pay gap and our ethnicity pay gap using the census date of 31 March 2024.
As required by the Equality Act 2010 (Gender Pay Gap Information) Regulations 2017, we publish the following information:
- Mean gender pay gap: Difference between the average hourly rate of pay for men and the average hourly rate of pay for women
- Median gender pay gap: Difference between the median hourly rate of pay for men and the median hourly rate of pay for women
- Mean bonus gap: Difference between the average bonus paid to men and the average bonus paid to women
- Median bonus gap: Difference between the median bonus paid to men and the median bonus paid to women
- Percentage of men and women in each hourly pay quarter
- Percentage of men and women receiving bonus pay
We also voluntarily publish our ethnicity pay gap (see ‘Ethnicity Pay Gap Report 2024’ section).
Pay gaps compare the average earnings for different groups within an organisation and relate to the distribution of different groups in the organisation and the roles they undertake. This is different from equal pay which measures whether different groups receive the same rate of pay for equal work, as set out in the Equality Act 2010.
We use job evaluation for our grade structure (grades A to J) and all management contract roles to systematically measure the relative value of jobs and ensure equal pay for equal work. The salaries of Vice-Chancellor’s Group are ratified by our Remuneration Committee, which considers a range of metrics and external data in determining pay levels.
There continue to be considerable market pressures in certain occupations, including IT and Finance, which impact starting salaries and increase the payment of additional supplements. Adjustments to procedures affecting pay decisions, e.g. at appointment stage, honoraria payments, and academic progression criteria, are continually monitored to ensure equal pay and transparency.
Gender pay gap report 2024
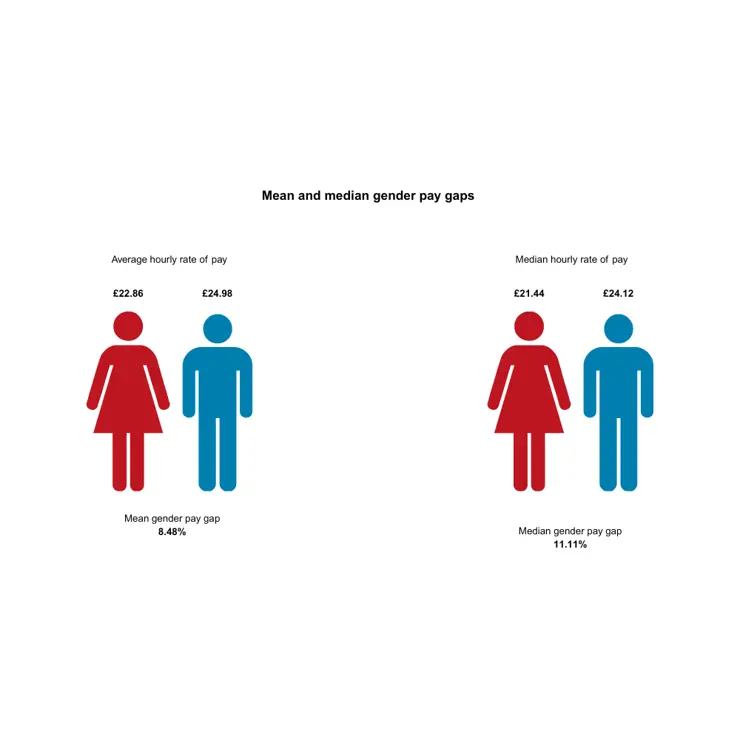
Mean and median gender pay gaps
In 2023/24, the mean gender pay gap has reduced to 8.48% from 9.08% in 2022/23. The median gender pay gap has increased to 11.11% from 8.26% in 2022/23.
Despite the increase in the median gender pay gap, the median gender pay gap at the University continues to be smaller when compared to the latest available figures for national median gender pay gap (14.3%6) and Higher Education Sector pay gap (11.9%7).
6 ONS, April 2024
7 THE November 2023 (HEPI report)
| Women (£) | 22.86 |
|---|---|
| Men (£) | 24.98 |
Mean Gender Pay Gap 8.48%
| Women (£) | £21.44 |
| Men (£) | £24.12 |
Median Gender Pay Gap 11.11%
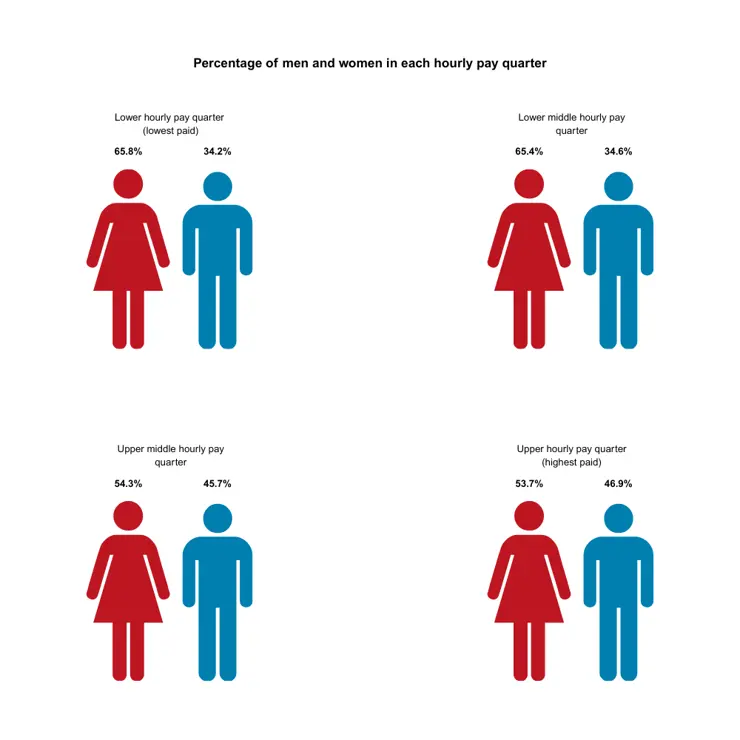
Percentage of men and women in each hourly pay quarter
| Women | Men |
|---|---|
| 65.8% | 34.2% |
| Women | Men |
|---|---|
| 65.4% | 34.6% |
| Women | Men |
|---|---|
| 54.3% | 45.7% |
| Women | Men |
|---|---|
| 53.7% | 46.9% |
Women occupy over half of our highest paid jobs (53.7%, compared to 46.9% of men). This is an increase from last year’s gender pay gap reporting (up from 51.7% in 2023 - see table 22).
Women are over-represented in the lower hourly pay quarter (65.8%) and lower middle hourly pay quarter (65.4%). However, the percentage of women in the lowest paid roles (lower hourly pay quarter) has decreased from 67.5% in 2023 to 65.8% in 2024.
| 2023 | 2024 | Direction of travel | |
|---|---|---|---|
| Lower hourly pay quarter | 67.5 | 65.8 | Down |
| Lower middle hourly pay quarter | 62.4 | 65.4 | Up |
| Upper middle hourly pay quarter | 55.2 | 54.3 | Down |
| Upper hourly pay quarter | 51.7 | 53.7 | Up |
Mean and Median bonus gap and percentage of men and women receiving bonus pay
We do not operate any performance-related reward or recognition schemes. Therefore, there is no information on mean or median bonus gap or the percentage of men and women receiving bonus pay.
Further information about the gender pay gap
Our gender pay gap is caused by both horizontal and vertical segregation within the University. Horizontal segregation is where there is uneven distribution of men and women in particular roles or grades, and vertical segregation is where men occupy roles at the higher end of the pay scale.
During the reporting year, we concluded a major academic restructuring exercise which has changed the gender profile of management roles, with a higher number of males than females being appointed to the more senior leadership posts within schools. Whilst women remain well represented within the schools, they occupy roles which are lower paid. Also, external recruitment has resulted in several male appointments to senior, highly paid roles within Financial Services, Estates, and LIS. Both these factors have significantly contributed to the increase in the median pay gap.
The majority of our professional services colleagues (64.6%) are women and a higher proportion of the lower graded roles in professional services are occupied by women and in many cases women working part-time. This impacts the overall gender pay gap.
There are some pay differentials within the School of Medicine, where a substantial number of colleagues are employed on the NHS Clinical Pay Scale, which perpetuates gender pay issues within the NHS. However, both Deans of the School of Medicine and School of Veterinary Science are female.
External market pressures have reduced the impact of starting salaries, with the vast majority of new starters appointed above grade minimum irrespective of gender. However, we’ll continue to monitor this and the application of market rate supplements to ensure that decisions remain robust and evidence based.
At Professor level, 43.8% of Professors and 60% of our top-level Professors are female.
For management contract holders, 51% below Senior Executive level are female, with an average salary of £81,720 compared to £84,722 for male managers. This results in a 3.5% gender pay gap for management positions.
Actions to address the gender pay gap
A range of actions are underway to address the gender pay gap as part of our Athena Swan Bronze institutional action plan and wider work. These include:
- Improve the pay of colleagues in lower graded roles, including living wage adjustment introduced from 1 April 2021 for colleagues in grades B and C.
- Further develop our reward and remuneration strategy, employee value proposition, starting salary guidelines and other pay structures to ensure these are equitable.
- Monitor starting salaries, evidence for decisions to appoint above grade minimum, external market pressures and potential ‘gendered’ occupations or sectors which may be subject to additional market supplements.
- Implement annual benchmarking of areas where difficulties in recruitment have resulted in the application of market supplements.
- Continue to monitor progression and promotion criteria to encompass skills and abilities including teaching and learning, innovation and enterprise, and professional practice.
- Continue to provide development opportunities for women, including: Aurora, Springboard, mentoring and coaching support, and provide support role models, and encourage women to apply for senior positions.
- Harness colleagues’ strengths, including considered workforce planning and targeted talent management programmes where women are less represented.
- Monitor and equality impact assess People practices and processes to ensure fairness and inclusivity and review policies to ensure we continue to promote flexibility in employment and support parents and those with other caring responsibilities.
- Continue to provide support for colleagues through shared parental leave, job sharing, compressed hours, and part- and term-time only opportunities. To also increase the visibility of family friendly policies, flexible working, and avoid scheduling of meetings for early morning or late afternoon.
- Monitor the management pay structure to facilitate more transparent linkages between knowledge and experience with pay, supporting improved pay equity, parity, and transparency regarding reward arrangements for roles occupied by both men and women.
- Monitor leaver data to identify ‘cliff-edge’ points for female progression and/or promotion.
Ethnicity pay gap report 2024
Although there is no legal requirement to publicly report on ethnicity pay gaps, we voluntarily publish our ethnicity pay gap as part of our commitment to creating a fairer, more diverse and inclusive university.
The information below relates to the pay gap between White colleagues and minoritised ethnic colleagues, using the census date of 31 March 2024.
Mean and median ethnicity pay gaps
The mean gap decreased to 3.82% and the median gap increased slightly to 2.90%.
The mean and median pay gaps have been impacted, to a certain extent, by the adjustments made to salaries in roles graded A – C to align with the Real Living Wage of £12.00 per hour.
| 2023 (%) | 2024 (%) | Direction of travel | |
|---|---|---|---|
| Mean ethnicity pay gap | 5.2 | 3.82 | Down |
| Median ethnicity pay gap | 2.83 | 2.90 | Up |
Percentage of minoritised ethnic colleagues in each hourly pay quarter
There has been a decrease in the proportion of minoritised ethnic colleagues in the lower pay quartile and slight increases in the middle two quartiles, most notably the upper middle quartile (see table below).
| 2023 (%) | 2024 (%) | Direction of travel | |
|---|---|---|---|
| Lower hourly pay quarter | 18 | 17 | Down |
| Lower middle hourly pay quarter | 15 | 16 | Up |
| Upper middle hourly pay quarter | 18 | 20 | Up |
| Upper hourly pay quarter | 12 | 12 | Same |
Actions to address the ethnicity pay gap
In 2023/24, we developed a five-year action plan as part of our Race Equality Charter submission. We’ll implement these actions to improve the representation and progression of minoritised ethnic colleagues.
A range of actions are also underway to address the ethnicity pay gap including:
- Increased ethnic diversity (45% minoritised ethnic members) of the Professorial and Readership Committee and guidance developed on EDI considerations for Committee members.
- Active encouragement by promotion panels of applications from minoritised ethnic colleagues.
- Development of Aspire programme, a talent management programme for minoritised ethnic colleagues to improve the visibility and impact of potential future leaders.
EDI Priorities for 2024-2025
In 2024-25, we’ll:
- Finalise and launch our updated Belonging Strategy.
- Evolve our current EDI Lead role and network and develop School and Service level EDI action planning.
- Review reward and recognition for EDI-related work.
Finalise and launch updated Belonging Strategy
In Belonging at the University, we committed to reviewing the institutional EDI measures, reported on in the ‘EDI Scorecard’ section. A wider review of our EDI strategy has taken place to ensure our colleagues understand the role they all play in creating an inclusive culture for students and colleagues, and in diversifying our student body and workforce.
In 2024-25, work will take place to finalise the updated Belonging Strategy. The aim of this work is to clarify why belonging and EDI matters and what it means for the University, and to ensure a whole University approach to belonging and EDI.
Evolve our current EDI Lead role and network and develop School and Service level EDI action planning
Working with our existing EDI Leads in schools and services, we’ll evolve the current EDI Lead role and network to ensure this role is integrated within every school and service and is supported to embed our revised Belonging Strategy and wider work, e.g. Race Equality Charter action plan, strategically and operationally in their areas. This will include developing effective school/service level action planning and reporting.
Review reward and recognition for EDI-related work
As part of the Race Equality Charter self-assessment and following feedback from EDI Leads, Colleague Diversity Network co-chairs, and a recent EDI Audit, we’ve identified the need to enhance the way we currently reward and recognise contributions to EDI-related work.
The review will consider how we can involve wider stakeholders in developing our EDI work, whilst ensuring that people from under-represented and marginalised groups are not doubly disadvantaged when they take time away from their own progression to advance EDI at the University. This work relates to the previous priority (evolving the current EDI Lead role) and builds on recent work to improve the support for, and sustainability of, our Colleague Diversity Networks. It will be informed by our Charter Mark work and the development of wider EDI workstreams which require involvement of people from under-represented and marginalised groups.
You can find instructions for downloading or printing this document below. However if you need a copy of this report in an alternative format, please email our Equality and Diversity team.